
Introduction: Why Your Hearing Health Matters More Than Ever
Hearing loss affects over 1.5 billion people worldwide, yet most people wait an average of 7 years before seeking help after noticing the first signs. One of the biggest barriers? Not knowing where to start.
That’s where an online hearing test and audiogram generator changes everything.
Whether you’re a patient curious about your hearing, a caregiver tracking a loved one’s hearing health, or an audiologist needing a quick digital tool for documentation — EarMart’s free Online Audiogram Generator gives you a professional-grade, printable audiogram report in minutes, right from your browser.
Acces Softwear Click Here
In this guide, we’ll walk you through:
- What an audiogram is and how to read one
- How to use EarMart’s free online audiogram tool
- What your hearing test results mean
- When to see a professional audiologist
- How to print or export your audiogram report as a PDF
What Is an Audiogram?
An audiogram is a visual chart that maps your hearing ability across different frequencies (pitches) and loudness levels (decibels). It’s the standard tool audiologists use to diagnose hearing loss and determine the type, degree, and configuration of any hearing impairment.
The audiogram chart plots:
- Frequency (Hz) on the horizontal axis — ranging from low-pitched sounds (250 Hz) to high-pitched sounds (8000 Hz)
- Hearing Level (dB HL) on the vertical axis — from very soft sounds at the top (0 dB) to very loud sounds at the bottom (120 dB)
The lower your hearing thresholds appear on the chart, the better your hearing. A normal hearing range typically falls between 0–25 dB HL across all frequencies.
Types of Audiogram Measurements
A standard audiogram captures two key types of hearing tests:
1. Air Conduction Testing
Air conduction tests how sound travels through the outer ear canal, middle ear, and inner ear (cochlea). It’s the standard test most people are familiar with — you wear headphones and press a button when you hear a tone.
- Right Ear (Unmasked): Plotted with a circle (○)
- Right Ear (Masked): Plotted with a triangle (△)
- Left Ear (Unmasked): Plotted with an X (×)
- Left Ear (Masked): Plotted with a square (□)
2. Bone Conduction Testing
Bone conduction bypasses the outer and middle ear entirely by sending vibrations directly to the inner ear through the skull. This test helps distinguish between conductive and sensorineural hearing loss.
- Right Ear (Unmasked): Plotted with (<)
- Right Ear (Masked): Plotted with ([)
- Left Ear (Unmasked): Plotted with (>)
- Left Ear (Masked): Plotted with (])
📌 Convention: Red symbols represent the right ear; blue symbols represent the left ear.
What Is a Pure Tone Average (PTA)?
The Pure Tone Average (PTA) is the average hearing threshold across the three most speech-critical frequencies: 500 Hz, 1000 Hz, and 2000 Hz. It’s the most commonly used single-number summary of a person’s hearing ability.
| PTA Range | Degree of Hearing Loss |
|---|---|
| 0 – 25 dB | Normal Hearing |
| 26 – 40 dB | Mild Hearing Loss |
| 41 – 55 dB | Moderate Hearing Loss |
| 56 – 70 dB | Moderately Severe |
| 71 – 90 dB | Severe Hearing Loss |
| 91+ dB | Profound Hearing Loss |
EarMart’s audiogram tool automatically calculates your PTA for both ears and displays a hearing classification, making interpretation easy and instant.
Introducing EarMart’s Free Online Audiogram Generator
EarMart has built a powerful, 100% free online audiogram tool designed for both patients and hearing care professionals. You can access it directly at:
👉 https://earmart.in/generate-online-audiogram/
No app download. No sign-up. No cost.
Key Features of EarMart’s Audiogram Tool
✅ Interactive Audiogram Chart — Plot hearing thresholds for both ears with a single click
✅ Multiple Test Modes — Supports Air, Air (Masked), Bone, and Bone (Masked) conduction
✅ Automatic PTA Calculation — Instantly calculates Pure Tone Average for 500, 1000, and 2000 Hz
✅ Hearing Classification — Displays degree of hearing loss based on WHO/ANSI standards
✅ Clinic Customization — Add your clinic name, address, phone number, and email
✅ Patient Details Section — Enter name, age, date, gender, referred by, and address
✅ Print-Ready Report — Generate a clean, professional audiogram printout
✅ Export as PDF — Download your audiogram as a PDF file for records or referrals
✅ Clear & Reset — Start fresh anytime with a single tap
How to Use EarMart’s Online Audiogram Generator: Step-by-Step
Step 1: Visit the Tool
Go to earmart.in/generate-online-audiogram/ on any device — desktop, tablet, or smartphone.
Step 2: Enter Patient Details
Fill in the patient’s name, age, date of test, gender, referring doctor, and address in the fields provided. This information appears on the printed report.
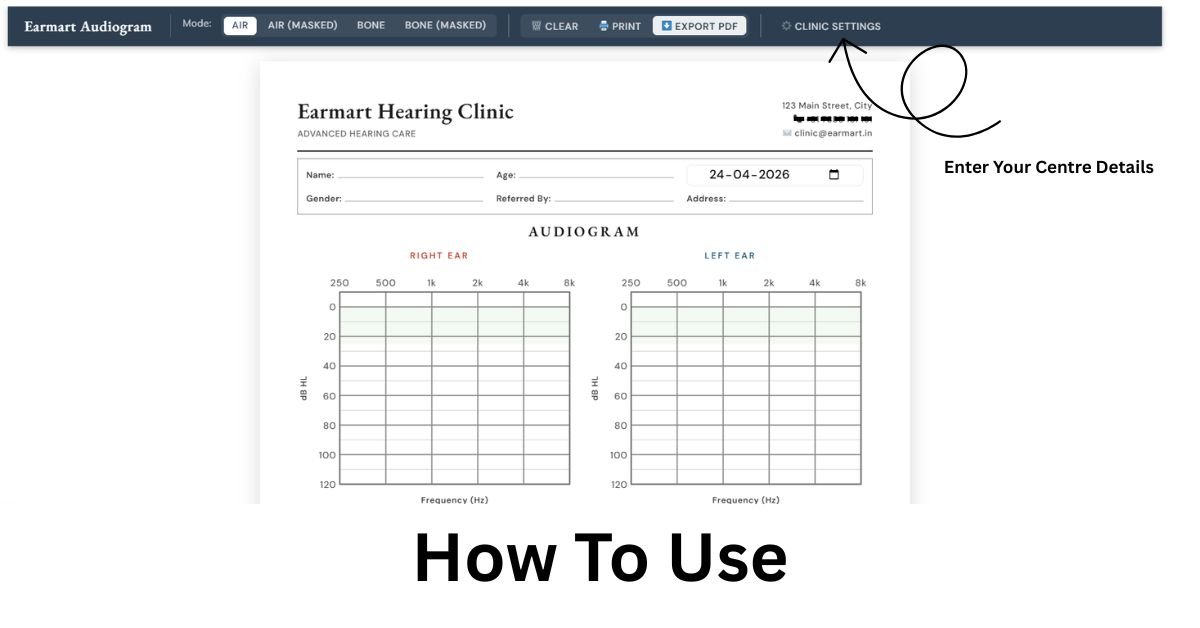
Step 3: Customize Clinic Settings (Optional)
Click on ⚙ Clinic Settings to enter your clinic’s name, address, phone number, and email. This personalizes the audiogram header for professional use.
Step 4: Select the Test Mode
Choose the appropriate mode from the dropdown:
- Air — Standard air conduction (most common)
- Air (Masked) — When masking is applied to the non-test ear
- Bone — Bone conduction testing
- Bone (Masked) — Masked bone conduction
Step 5: Plot the Hearing Thresholds
Click on the audiogram chart at the appropriate dB level for each frequency (250 Hz to 8000 Hz). Plot values for both the right ear and left ear separately. The tool will automatically assign the correct symbols and colors.
Step 6: Review the PTA & Classification
The tool instantly displays:
- PTA (Pure Tone Average) for each ear at 500, 1000, and 2000 Hz
- Overall hearing classification (Normal, Mild, Moderate, etc.)
Step 7: Print or Export as PDF
Click 🖨 Print for a browser print dialog, or ⬇ Export PDF to download a clean, professionally formatted audiogram report.
Who Should Use This Online Audiogram Tool?
👩⚕️ Audiologists & Hearing Care Professionals
Generate quick printable audiogram reports during screenings, camps, or tele-audiology sessions without expensive software.
🏥 ENT Clinics & Hospitals
Use it for documentation at rural health camps, outreach programs, or as a backup tool when primary systems are unavailable.
👨👩👧 Patients & Caregivers
Input results from a recent hearing test to get a visual representation and better understand your diagnosis before or after a clinic visit.
🎓 Audiology Students
Practice reading and creating audiograms as a learning exercise with a real, interactive tool.
How to Read Your Audiogram Results
Once your audiogram is plotted, here’s how to interpret what you see:
Normal Hearing
All thresholds fall between 0–25 dB across all frequencies. This means you can hear soft sounds clearly.
Mild Hearing Loss (26–40 dB)
You may struggle to hear whispers or soft speech, especially in noisy environments.
Moderate Hearing Loss (41–55 dB)
Conversational speech at a normal volume becomes difficult to follow without a hearing aid.
Moderately Severe (56–70 dB)
You need louder-than-normal speech to understand conversations. Hearing aids are strongly recommended.
Severe Hearing Loss (71–90 dB)
Only very loud sounds are audible without amplification. Hearing aids or cochlear implants are typically needed.
Profound Hearing Loss (91+ dB)
Very little residual hearing remains. Communication may rely heavily on lip reading, sign language, or cochlear implants.
Types of Hearing Loss Explained
Understanding the shape of your audiogram is just as important as the thresholds:
| Audiogram Shape | Likely Condition |
|---|---|
| Flat loss across all frequencies | Conductive hearing loss (fluid, wax, perforation) |
| Ski-slope (high-frequency loss) | Noise-induced or age-related hearing loss (presbycusis) |
| Cookie-bite (mid-frequency loss) | Genetic or hereditary hearing loss |
| Low-frequency loss | Meniere’s disease or endolymphatic hydrops |
| Unilateral (one ear only) | Sudden sensorineural hearing loss, acoustic neuroma |
Common Signs You Should Take a Hearing Test
Not sure if you need one? Watch for these warning signs:
- 🔊 Frequently asking people to repeat themselves
- 📺 Turning the TV or phone volume up higher than others prefer
- 😕 Difficulty understanding speech in noisy environments
- 📞 Struggling to hear on phone calls
- 🔔 Ringing or buzzing sounds in the ears (tinnitus)
- 😶 Feeling left out of conversations in groups
- 💤 Missing alarms or doorbells
- 👴 Family history of age-related hearing loss
If you experience any of these symptoms, consider getting your hearing evaluated professionally — and use EarMart’s audiogram tool to document and track your results over time.
Is an Online Hearing Test Accurate?
An online audiogram plotting tool like EarMart’s is not a diagnostic hearing test itself — it is a report generator where you or your audiologist manually input thresholds obtained from a clinical audiometer or a calibrated digital hearing screener.
However, when results are entered correctly:
- ✅ The PTA calculations are mathematically accurate
- ✅ The hearing classification follows clinical standards
- ✅ The printout is appropriate for patient records and referrals
- ✅ The visual audiogram matches what a clinical audiologist would produce
For a full diagnostic hearing evaluation, always visit a licensed audiologist with a calibrated audiometer in a soundproof booth.
Why Printable Audiogram Reports Are Important
A printable or PDF audiogram report is valuable in many real-world situations:
- Doctor Referrals: Share your results with an ENT specialist or physician
- Hearing Aid Fitting: Audiologists use your audiogram to program hearing aids precisely
- Medical Records: Keep a documented history of your hearing health over time
- Insurance Claims: Some insurance providers require audiogram documentation
- School or Workplace Accommodations: Provide evidence of hearing impairment for accessibility support
- Second Opinions: Take your report to another audiologist for verification
EarMart’s tool makes generating a professional, printable report effortless — no appointments needed.
Hearing Loss in India: The Growing Need for Accessible Tools
India has over 63 million people with significant hearing loss, and access to qualified audiologists remains limited in semi-urban and rural areas. Free digital tools like EarMart’s audiogram generator help bridge this gap by:
- Enabling audiologists at outreach camps to document results without heavy equipment
- Empowering patients to better understand their hearing health
- Supporting tele-audiology and remote care models
- Reducing barriers in underserved communities
EarMart is proud to be a Made-for-India hearing health solution, combining affordable hearing aids with accessible digital tools built for the Indian healthcare ecosystem.
EarMart: Your Complete Hearing Health Partner
Beyond the free audiogram tool, EarMart offers a full ecosystem of hearing health products and services:
- 🎧 Premium Hearing Aids — Brands like Signia, Phonak, Widex, Oticon, Unitron, Starkey, and ReSound
- 💰 Flash Sale Deals — Up to 50% discount on top hearing aid models
- 📍 Find a Clinic — Locate EarMart partner clinics across India
- 🛒 Online Store — Shop BTE, RIC, CIC, ITC, ITE, and Bluetooth hearing aids
- 📦 Order Tracking — Track your hearing aid delivery in real time
- 📞 Expert Support — Call 08069409942 for guidance from hearing care specialists
Frequently Asked Questions (FAQs)
Q1: Is EarMart’s online audiogram generator completely free?
Yes. The tool is 100% free to use with no registration, no login, and no hidden charges.
Q2: Can I use this tool on my mobile phone?
Yes. The EarMart audiogram tool is mobile-responsive and works on smartphones, tablets, and desktops.
Q3: How do I export my audiogram as a PDF?
Click the ⬇ Export PDF button on the audiogram tool page. Your report will be downloaded directly to your device.
Q4: Can audiologists use this tool for patients?
Absolutely. The clinic settings feature allows you to add your clinic’s branding to every report, making it suitable for professional use.
Q5: Does this tool replace a clinical hearing test?
No. This is a report generation and visualization tool. A formal hearing diagnosis requires a calibrated clinical audiometer operated by a licensed audiologist in a controlled sound environment.
Q6: What frequencies does the audiogram cover?
The tool covers the standard clinical frequencies: 250 Hz, 500 Hz, 1000 Hz, 2000 Hz, 4000 Hz, and 8000 Hz.
Q7: How do I clear the audiogram and start over?
Click the 🗑 Clear button to reset the chart and enter new data.
Conclusion: Take Charge of Your Hearing Health Today
Your hearing is one of your most vital senses — and understanding it shouldn’t require a complicated process or expensive software. EarMart’s free online audiogram generator puts professional-grade hearing documentation in your hands, whether you’re a patient, caregiver, or healthcare provider.
Plot your thresholds, calculate your PTA, generate a printable audiogram, and take the first step toward better hearing health — all for free, all in minutes.
👉 Generate Your Free Audiogram Now → earmart.in/generate-online-audiogram/